Online Signature
Easier, Quicker, Safer eSignature Solution for SMBs and Professionals
Quickly and effortlessly sign, send, track, and collect electronic signatures with CocoSign’s trusted and legally binding eSign software.
- No credit card required
- 14 days free
Sign Effortlessly
All your documents can now be signed online easily, quickly, and securely, whether by yourself, by others, virtually, or face-to-face on a single device.
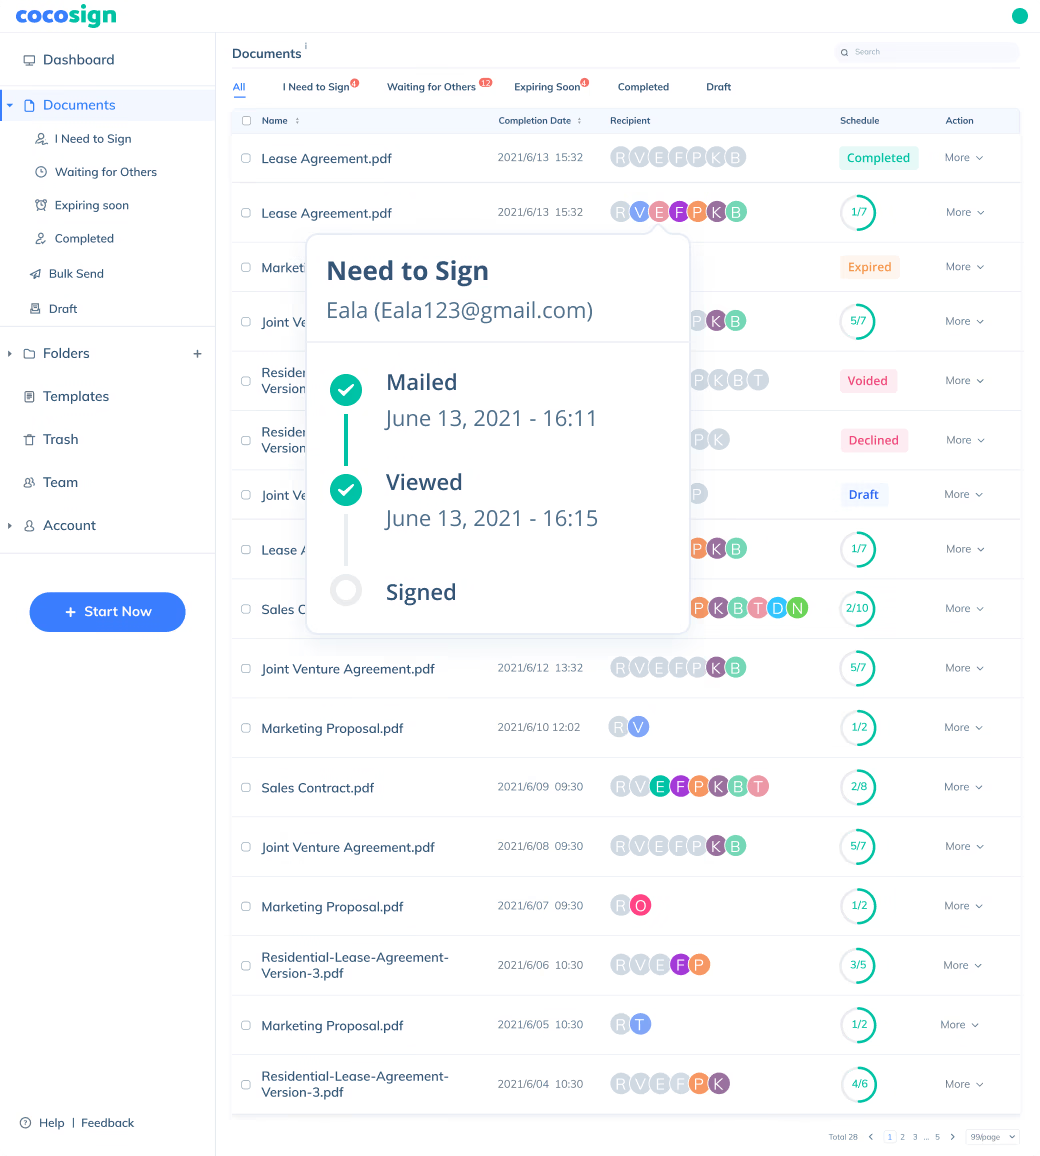
Send documents for signature
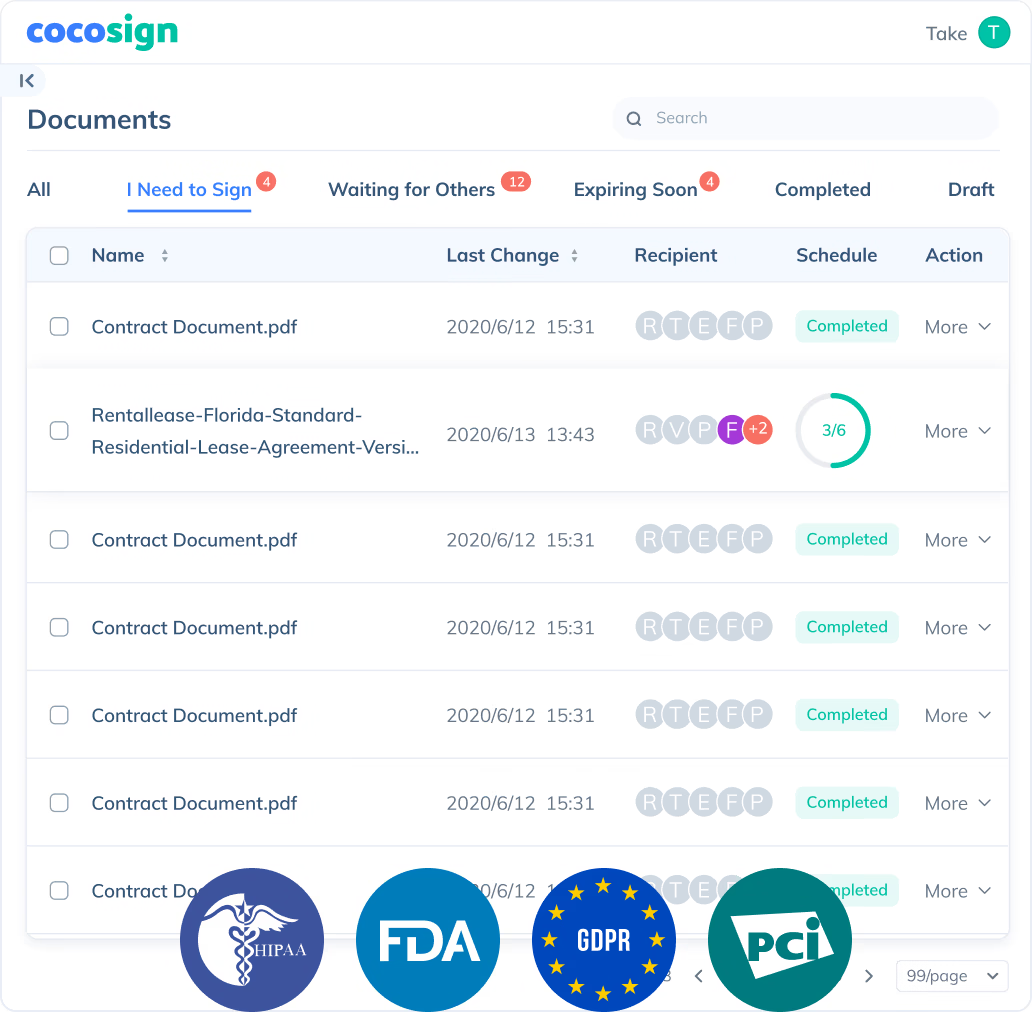
Send, track and manage your signature requests for multiple recipients effortlessly.
Learn more about e-signatures

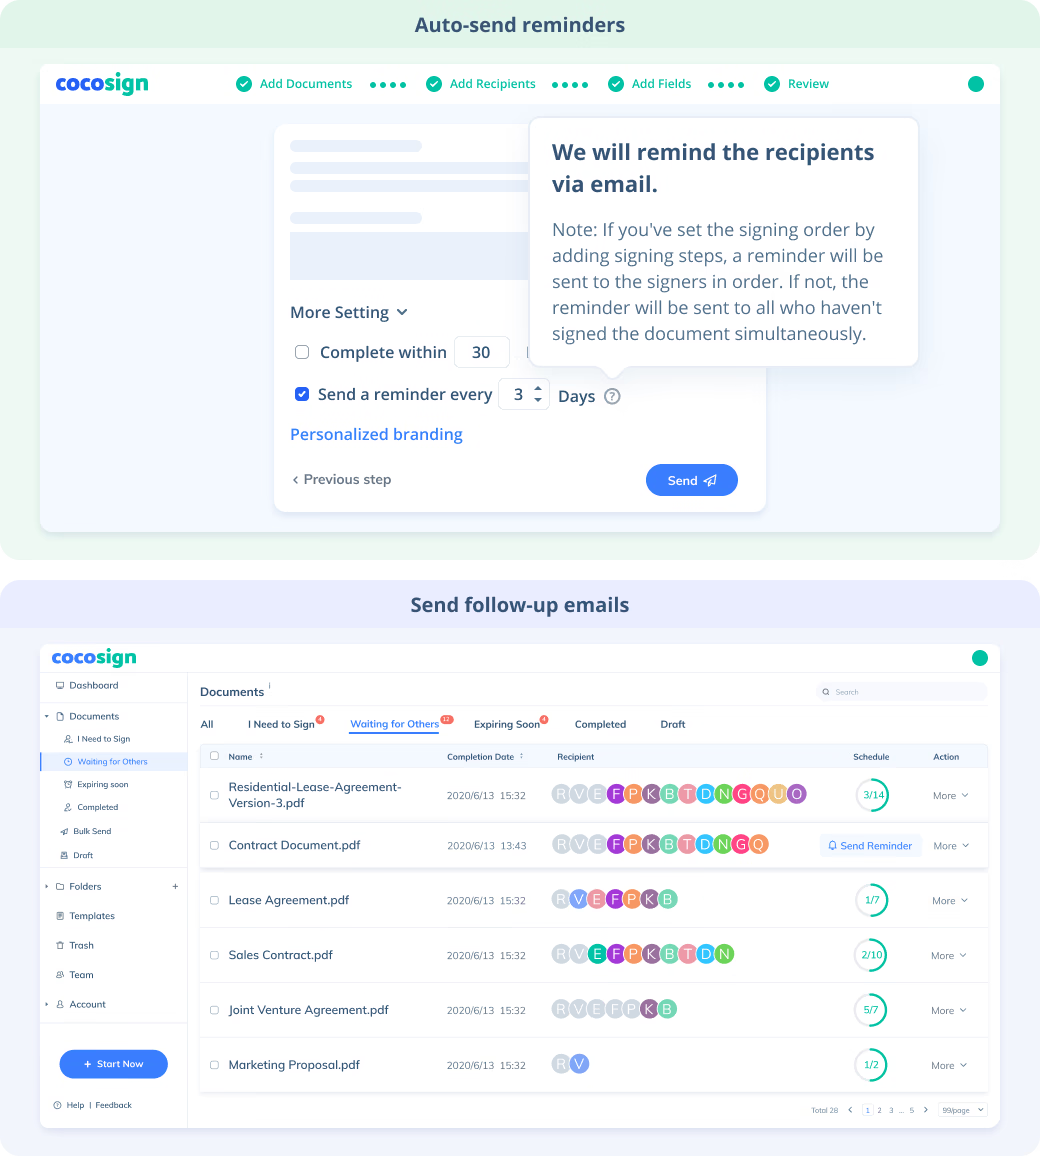


Sign Efficiently
No more chasing down on your signers endlessly. CocoSign will track all signing progress automatically and remind signers to finish signing punctually.
Sign Securely
Worryfree from signature forgery, fraud and data leaks, with CocoSign’s reliable and legally valid eSignature service.


Sign with Your Brand
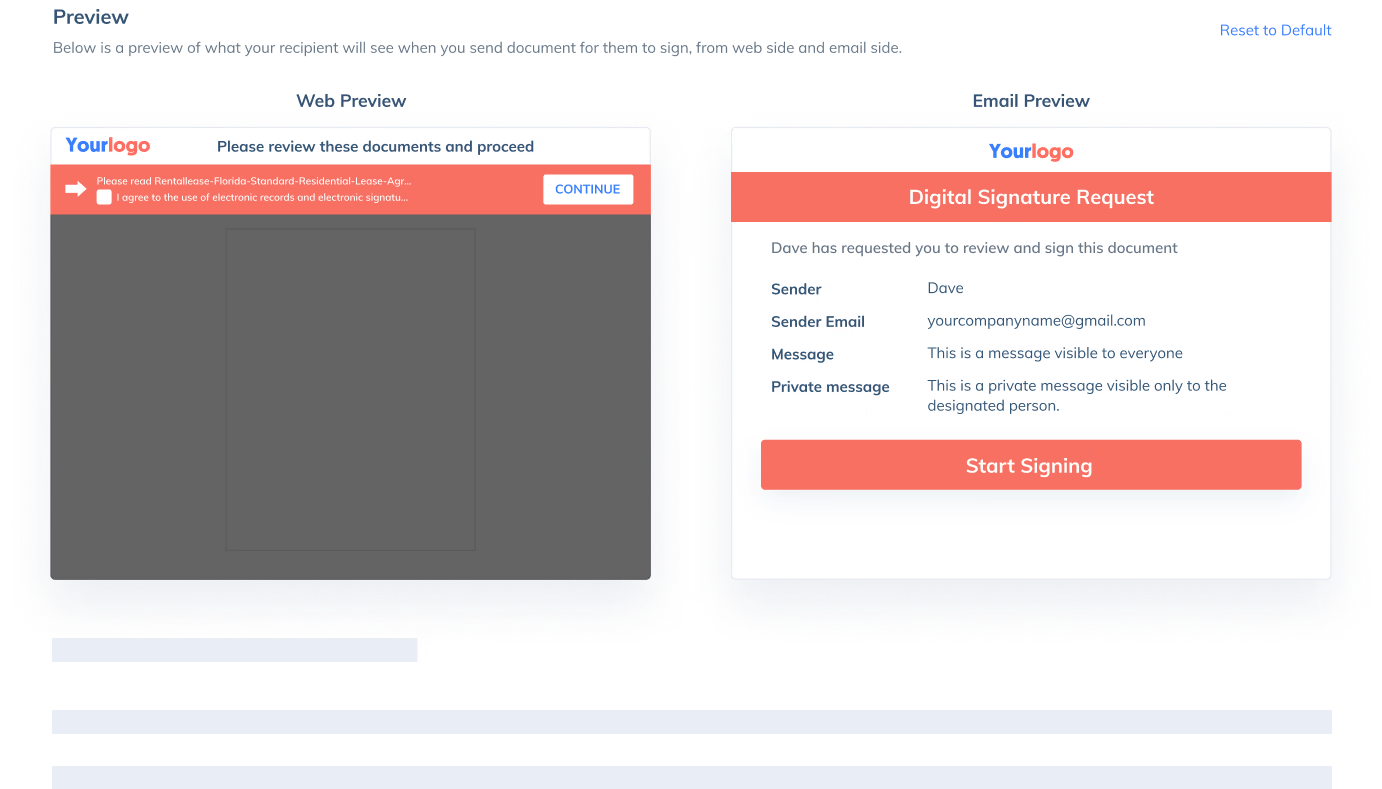
Fully reflect your brand instead of CocoSign’s when you send out signature requests to your signers while enjoying free publicities.


Award-winning eSignature solution
Digitally sign documents yourself and email the signed copies to others, get documents signed on the spot, or send documents to request signatures.


Customer Story


Sandra Adee
Real estate agent - Pro Buranto
We’re seeing an increasing number of deals. We want to finalize contracts faster and easier. Luckily, CocoSign comes to rescue. Initially we were concerned about its security. CocoSign’s friendly customer support patiently introduced to me its security measures and legal validity. So we have been relieved since then! The tool is extremely convenient! We saved our contracts as templates in our laptop. Once satisfied, owners and customers can sign face to face and close the deals on the spot. It archives our contacts to Google Drive so we don’t need to manage paperwork manually. Really a blessing.


Hector L. Kelly
Management Officer - CARENT
We are expanding faster than expected as a healthcare company, and we don't have time to spend on office work. It’s inconvenient for us and our clients to sign paperwork while dealing with other needs. Organizing paperwork, signing and delivering it to clients, and waiting 2-3 days weren’t satisfying, reducing our efficiency. We turned to CocoSign since then, and it's given the most exemplary results we've ever seen. CocoSign allows us to gather and incorporate digital signatures in documents. It streamlines our workflow. Our clients are also satisfied with the easy signing process.


Benjamin B. Borba
Lawyer - Mattorts
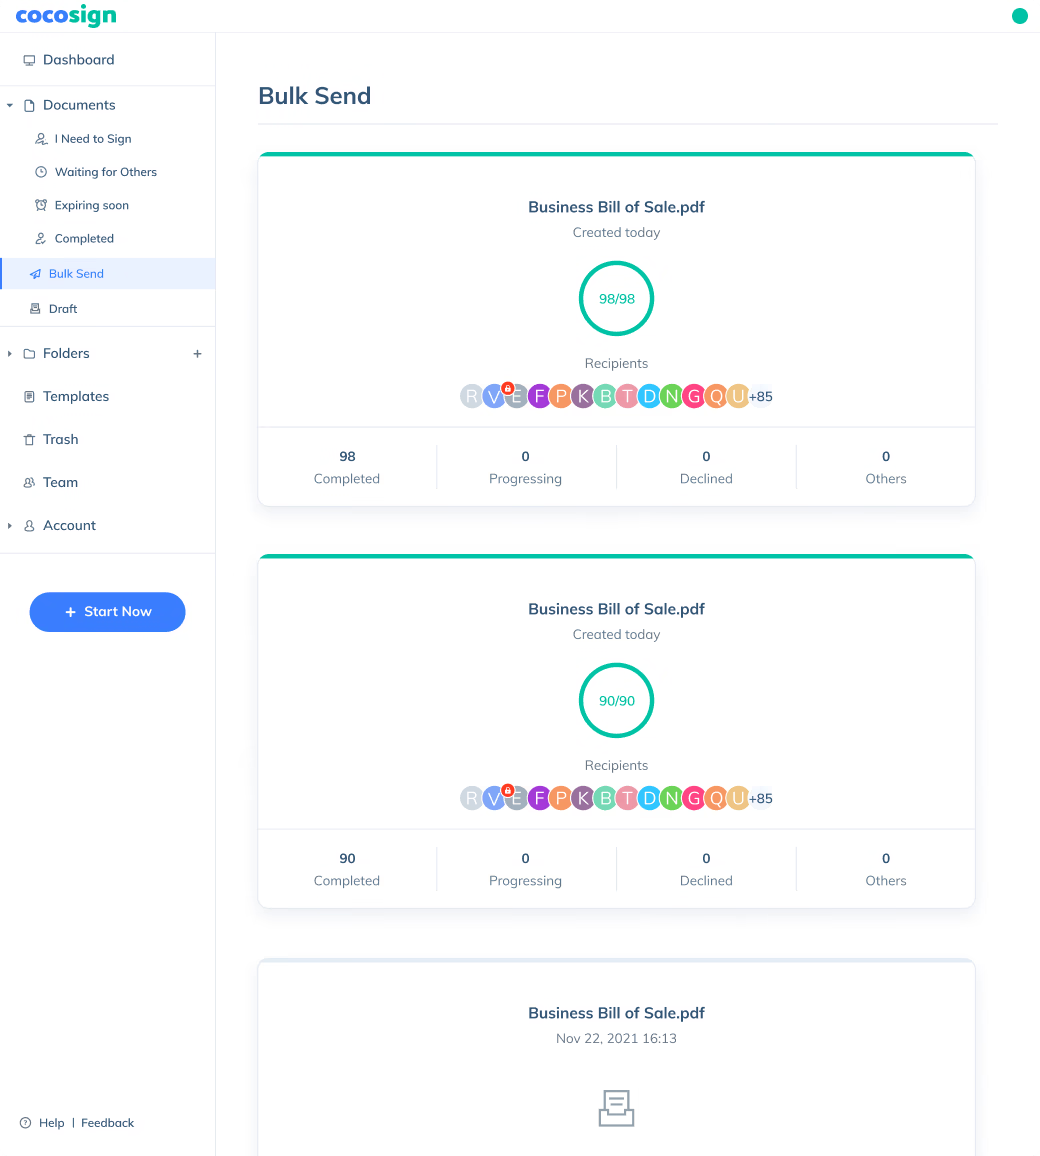
I run a budding law firm with only a few staff under me. We were facing many problems, like managing paperwork. My employees found it a hassle to travel to all the client’s places to get the documents signed. I came to know about CocoSign from my friend. With it, we can get the papers signed digitally in bulk or one by one from any place. Another impressive feature relates to notification. CocoSign notifies me whenever someone accesses or edits my document, saving it from unlawful activities. Now, CocoSign is an asset for my law firm.


Gur Tirosh
Insurance agent - ASSETER
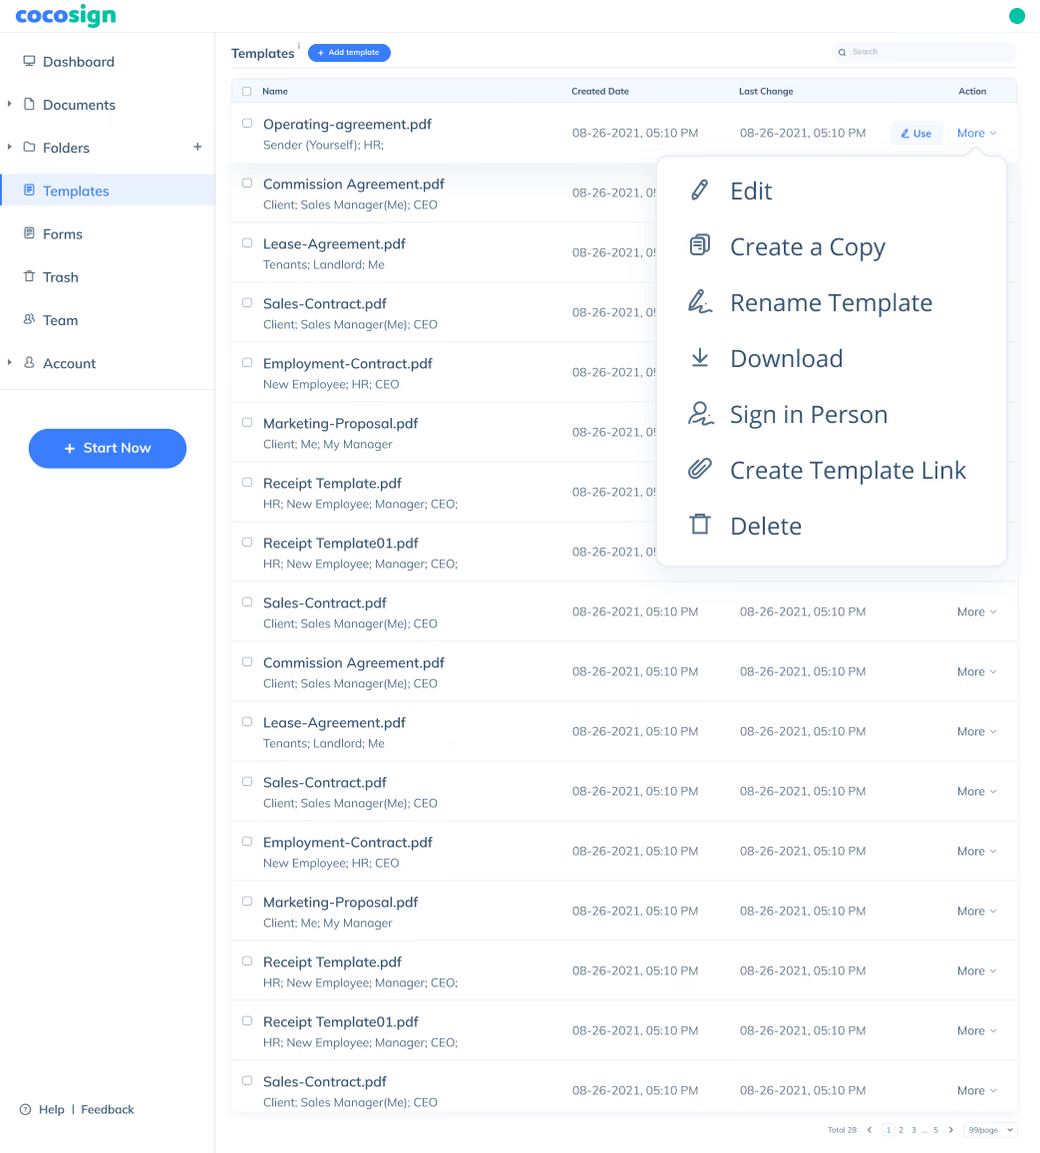
As a growing insurance company, increasing demands attracts loads of paperwork. Our agents had to deliver the documents to our clients manually, which took both money and time. CocoSign made this process easier. We use the template feature most. We save the most commonly used documents as a template and set up the signing fields in advance, relieving us from repeated paperwork preparations. Our agents don’t even bother to chase clients down as CocoSign automatically reminds them to sign in time. If anyone needs a one-stop e-signature solution, CocoSign fits the bill.
Sandra Adee
Real estate agent - Pro Buranto
We’re seeing an increasing number of deals. We want to finalize contracts faster and easier. Luckily, CocoSign comes to rescue. Initially we were concerned about its security. CocoSign’s friendly customer support patiently introduced to me its security measures and legal validity. So we have been relieved since then! The tool is extremely convenient! We saved our contracts as templates in our laptop. Once satisfied, owners and customers can sign face to face and close the deals on the spot. It archives our contacts to Google Drive so we don’t need to manage paperwork manually. Really a blessing.
Hector L. Kelly
Management Officer - CARENT
We are expanding faster than expected as a healthcare company, and we don't have time to spend on office work. It’s inconvenient for us and our clients to sign paperwork while dealing with other needs. Organizing paperwork, signing and delivering it to clients, and waiting 2-3 days weren’t satisfying, reducing our efficiency. We turned to CocoSign since then, and it's given the most exemplary results we've ever seen. CocoSign allows us to gather and incorporate digital signatures in documents. It streamlines our workflow. Our clients are also satisfied with the easy signing process.
FAQ
What is an electronic signature?
Also known as eSignature, an electronic signature is a digital form of signatures to convey consent or approval on online forms such as contracts and agreements, as opposed to paper signatures. It’s usually legally binding, highly encrypted, and strictly audited.
Is CocoSign a free electronic signature service?
Yes. CocoSign is a leading eSign platform providing legal, secure and free electronic signature services. You can sign documents yourself or send for others to sign for free on CocoSign with no credit cards required, no setup fees, and also no time limits. You can sign unlimited documents and download 3 signed ones, as a free user.
Are CocoSign’s e-signatures legally valid?
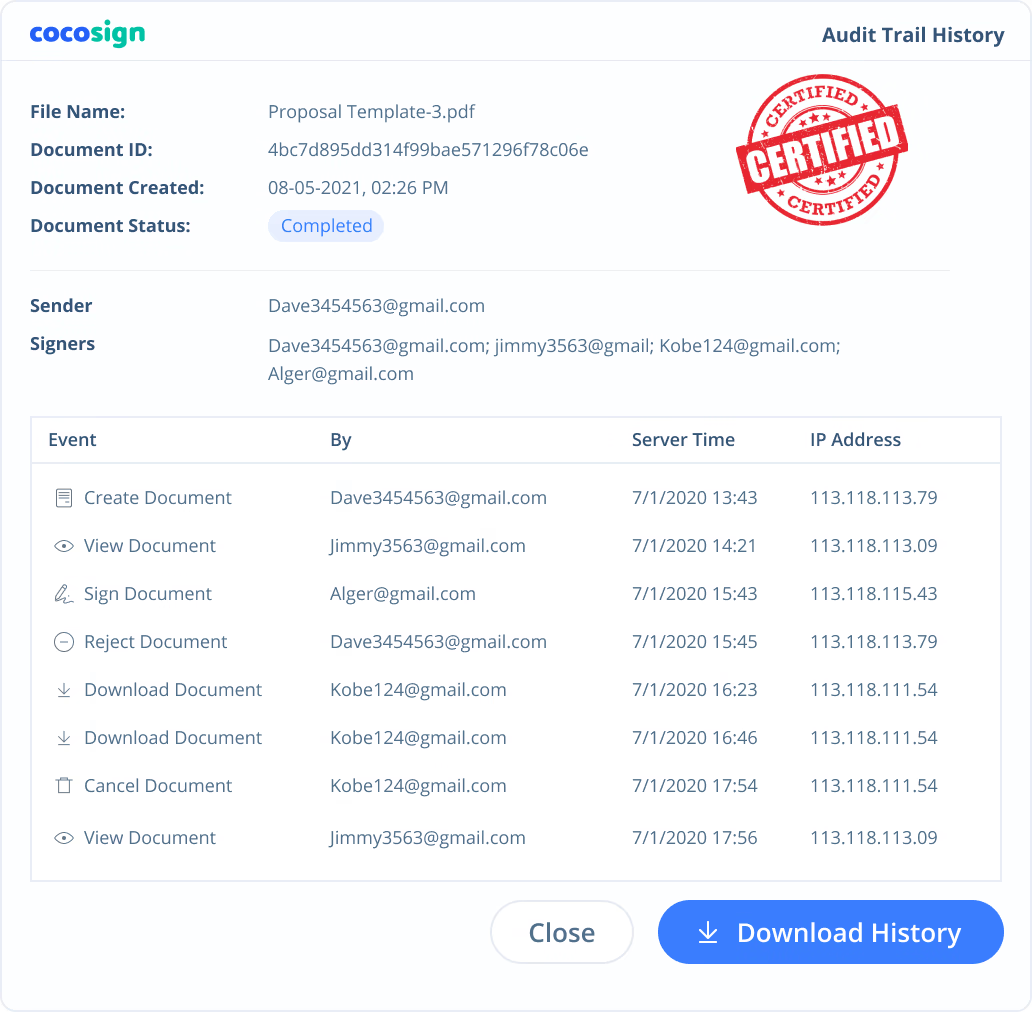
Yes. CocoSign’s eSign complies with various signature laws and security regulations. Its eSignatures are also HIPAA, PHIPA compliant. CocoSign also provides audit trail history for every signing activity with comprehensive information such as the signers’ IP addresses, email addresses, and fingerprints. All these make sure of the validity of eSignatures powered by CocoSign. You can even use them as court evidence if needed.
Are e-signatures secure?
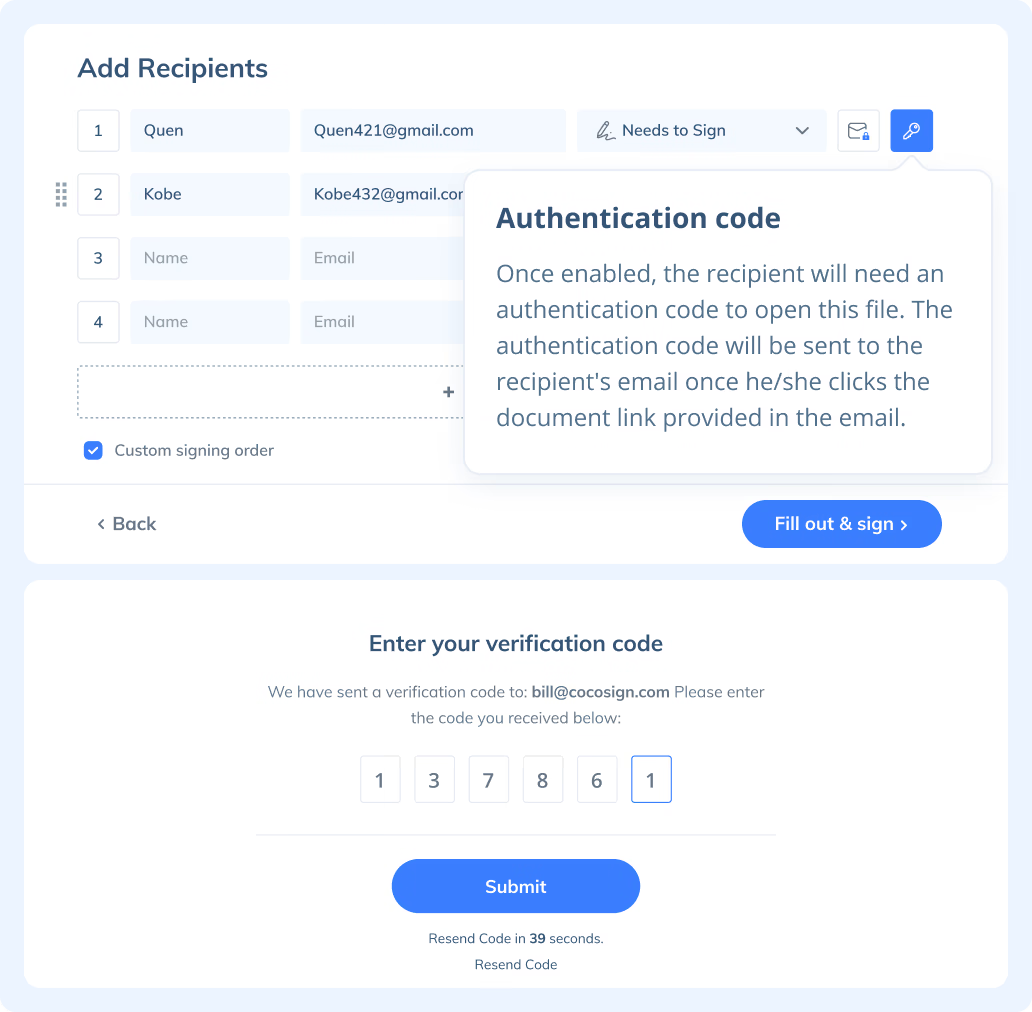
Yes. CocoSign prioritizes eSignature security over anything else. From identity authentication to data transmission and storage, to auditing, CocoSign adopts bank-level encryption measures to ensure the maximum security of all your signed data, throughout the entire signing journey.
How do I create an electronic signature?
Creating an electronic signature with CocoSign is super easy. Simply type or draw your name on CocoSign’s signature generator page, and you get to personalize your own eSignature. Or you can upload your ready-made signature onto CocoSign’s platform.
What is digital signature?
Digital signature is a unique type of electronic signature, usually with a much higher level of security than common esignatures. It requires signers to authenticate their identities with a certificate-based digital ID. Compliant with the strictest legal regulations, it can be used for signing transactions of high risks, sometimes with the capacity to rival handwritten signatures due to its strong immunity against forgery and theft.
Is a digital signature the same as an electronic signature?
There are different types of electronic signatures with various levels of evidential legality as well as many other factors.The digital signature is one of them. Compared to common eSignatures which adopt regular authentication methods for signer identity verification, digital signatures employ stricter certificate-based digital IDs for the same purpose.
How to Electronically Sign a PDF?
eSigning a PDF with CocoSign is easy. Here is how:
- Step 1: Log in CocoSign with your Google account or register a new CocoSign account.
- Step 2: Choose between Send for Signatures and Sign Yourself.
If you need to sign a PDF yourself, simply upload the document and drag the necessary fields from the toolbar on the right and finish signing. Hit the button Download after you complete signing.
If you need to send a document out for others to sign, select Send for Signatures in the dashboard, upload the file, add recipients and then add recipients before sending it out. CocoSign will then help you follow up on signers and update you once anyone finishes signing. At last, a final signed PDF copy will be sent to your email for downloading.
Easier, Quicker, Safer eSignature Solution for SMBs and Professionals
- No credit card required
- 14 days free